| % of Population | Lower bound | Upper bound |
| 0% - 20% | $0 | $20,712 |
| 20% - 40% | $20,712 | $39,000 |
| 40% - 60% | $39,000 | $62,750 |
| 60% - 80% | $62,750 | $100,250 |
| 80% - 95% | $100,250 | $180,000 |
| 95% - 100% | $180,000+ |
I suspect that as many of you own computers and surf the web, it is likely that a few are middle class, but the overwhelming majority are Upper class. Yeap, I am probably shattering your little world of conformity, but you are not what you think. But to make you feel better, academics have different definitions, one considers Upper middle as 85%-99%, and then Lower middle as 55-85%, and Working class 25-55%. Below that is divided between Working poor, and Underclass. That should make you feel better, middle class is between 55%-99% of the income range. That just seems wrong to me. There are other definitions you can see here.
And so average? Again the Census Bureau reports it was $49,777 for 2009.
Number of people in the US covered by health insurance? 253.6 of 308.7 million, or a surprising 82%, of which 15.4% of total is covered under Medicaid, with an additional 14.7% covered by other government insurance. Those numbers blew me away!!! 82% of the population is already covered by health insurance. Makes sense now that I think about it.
And who pays how much in taxes?
% of Population based on income % of Federal income
0-50% 3.6%
51-99% 62.7%
99-100% 33.7%
That troubles me greatly, half the population essentially pays nothing for the land, defense, services, roads, and all of the national services and protections. This not mean they do not pay state and local taxes.
And how much is in your 401k?
| Age of householder | 2007 Average Value, all Accounts | 2007 Median Value, all Accounts | |
|---|---|---|---|
| Under 35 years old | $25,279 | $9,600 | |
| 35 to 44 | 81,308 | 37,000 | |
| 45 to 54 | 156,124 | 63,000 | |
| 55 to 64 | 271,920 | 100,000 | |
| 65 or older | 207,321 | 60,800 | |
| All households | 148,579 | 45,000 |
Given the spread between Average and median, you have to believe that the median values are more likely the common values, and the average is swayed by the really really rich, which given the other numbers in this post is not hard to believe. This data comes from here.
And we should consider debt, and a better analysis and breakdown from 2 years ago by USA today...Total Personal debt: $121,953 per household which breaks down to $89,514 in mortgage, $22,231 in consumer (credit cards, auto loans, etc), and $10,208 in Other.
But there is more, on the government side I typically report only the national debt (the $14 Trillion owed) but there is more. Some of this is fear mongering, so do not go whacky on these numbers as it is hard to tell the truth from the bending of the truth.
Total government debt per household is $546,668
which breaks down to $284,288 in Medicare, $160,126 in Social Security***, $54,537 in national debt, $29,694 in military retirement, $15,851 in civil servant retirement, and $2,172 in other. I will note, the social security is a bit of fear mongering, as social security is not really owed, it is a guess of how much needs to be in the account to pay out in the future, but we can always pay out less if it comes to that. Of course I suspect that it will not be a pleasant discussion.
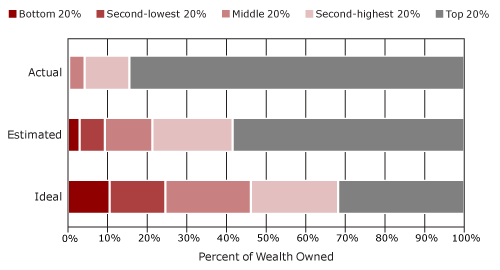
And on to wealth, or how much money you actually have, here is a fascinating graph showing what actually is, what people think it is, and what they think it should be from the University of California at Santa Cruz
Note please that Estimated bottom 40% have 10% of the wealth, but in fact not even the 40-60% bracket (average) actually has that much!
I hope this was helpful, as it should put into perspective things in the future.
Once again if you wish, email me and will add you to an email list that will be pinged when I post. Best I can do for now. Email is patrick14384 (at) gmail.com (sorry the cryptic, but lots of robots rummaging around the web).


The federal tax thing doesn't trouble me. Everyone who earns a paycheck pays the payroll and FICA taxes for social security and medicare. Besides, as your bar graph points out, that lower 50% doesn't have any money!
ReplyDeletehttp://en.wikipedia.org/wiki/Lucky_duckies